David Stockman's Contra Corner
November 10, 2025
Despite all the gumming this morning about New York City's allegedly shocking election of a self-professed socialist mayor, the real point is that New York City is already tantamount to a Welfare State dystopia. The election of Mamdani, therefore, is more in the nature of a pre-needs bankruptcy filing, which will now surely coming steaming down the tracks at an accelerating pace.
In one sense, the tables below comparing the finances of New York City (NYC) with the next nine largest US cities tells you all you need to know. When it comes to spending and taxing the bejesus out of its own citizens, NYC stands at the top of the heap. And when you dig into the numbers and standardize the comparisons, the story is every bit as bad as it appears on the surface.
As it happens, New York City finances are highly centralized in a unitary city-county entity, which is unlike many large cities where local government functions are split between the city, the county, independent school districts and other special purpose units of local government. Los Angeles provides a good example of the latter where only 34% of local govenrment spending runs through the city budget proper-with the balance handled by the county, the Los Angeles Unified School District and other entities.
So in order to obtain apples-to-apples budget and tax comparisons among the top 10 cities, we use the standardized data produced by the Lincoln Institute, which converts municipal spending by relevant units of local government into a "fiscally standardized cities"(FiSC) measure. The latter aggregates all spending for municipal functions within a city's borders, including that provided by county governments or special districts, such as independent school systems.
Thus, New York City's budget outlays in FY 2024 posted at the staggering sum of $107.1 billion, which amounted to $12,476 per capita among the city's population of 8.413 million. Yet even when you use the FiSC measure for the next nine largest cities shown in the table below, it is evident that New York is well at the top of the heap.
New York's total per capita budget outlays, for instance, are 14% higher than Chicago, 25% higher than Los Angeles, 41% higher than Phoenix, 71% higher than San Antonio, and nearly 40% more per capita than the average for the next nine largest cities in the US.
Nor can the NYC's Brobdingnagian budget be explained by Gotham being some kind of special refuge for the poor and downtrodden. Its poverty population of 1.53 million represents 18.2% of its total population, which is only a tad above the weighted average of 16.3% poverty population for the next 9 large cities.
Moreover, there are several large cities that have higher poverty rates than New York City, but nevertheless have spending levels per capita that are substantially below those of the SRG (Socialist Republic of Gotham).
Thus, Houston with a poverty rate of 21.2% spends only $7,790 per capita or just 64% of New York's level. Likewise, the busted down city of Philadelphia has a 20.3% poverty rate but it's apples-to-apples spending is just 86% of that for NYC.
More importantly, the column we have labeled "OSR", or own source revenue, tells the crucial story. It measures city-imposed taxes-setting aside all other funding sources such as Federal and state grants and spending attributable to county budgets, school districts or other special purpose authorities-funding which nevertheless helps defray the total FiSC outlays shown in the second column.
This distinction is important because in the case of New York City's highly centralized finances the political battles over funding for the whole array of functions and services provided within the city budget end up focusing on the two major "own source" revenue spigots--citywide income taxes and property taxes.
By contrast, in the case of Los Angeles, for example OSR funds only 21% of total outlays and amounts to $2,065 per capita versus New York's OSR of $9,444 per capita.
Indeed, as is evident in the tables New York City is in a league of its own when it comes to OSR per capita. And as we amplify below, if the OSR tax base were to take flight from New York City the whole fiscal house of cards under its $105 billion budget would come tumbling down.
Top 10 US Cities Budgets, OSRs and Poverty Population
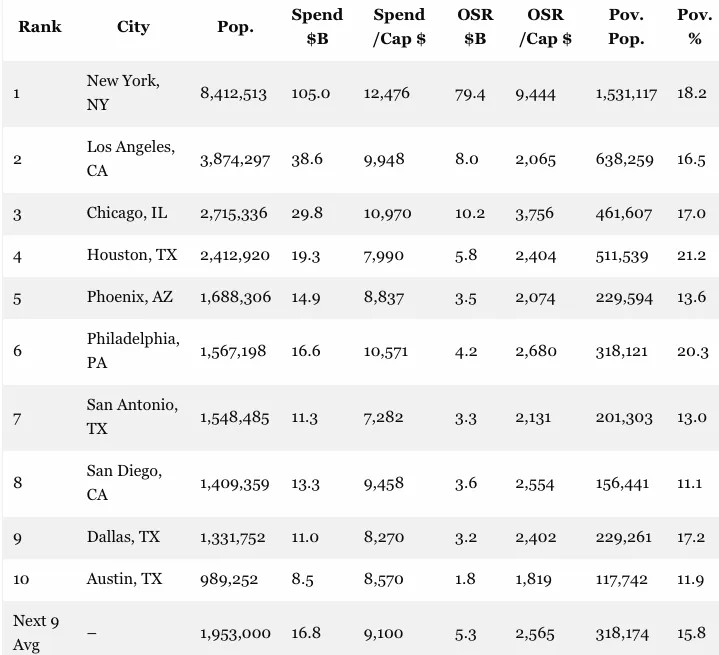
Notes: Out = Total Spend (from Fiscally Standardized Cities 2021 data, standardized local spending incl. overlapping govts.); OSR = Own Source Revenue (2024 city budgets); Pov. = Poverty. Next 9 Avg: simple averages (pop/total weighted for pop; unweighted for others).
Before we get further into what is already New York City's tax base fragility, it needs be noted as to how these budgets are allocated among programs and functions, and the reasons why NYC spending levels per capita are so significantly above the other nine largest US cities.
Accordingly, in the first three columns we have provided per capita spending for what might be considered traditional municipal functions. These are labeled Streets/Sanitation, Public Safety (fire and police) and Municipal Transportation. New York's spending of $1,805 per capita for these functions is only slightly above or below the comparable figures for LA, Chicago, Houston, Philadelphia and San Diego.
And even when you include some of the more thriftily-run big cities in Texas, the average per capita spending for traditional municipal functions is $1,530 for the next nine cities. This means that NYC's level is just 18% higher-mainly because its municipal unions are far more powerful.
By contrast, when it comes to health services, municipal hospitals and Medicaid, for example, NYC spending at $1,892 per capita is 53% higher than LA, 92% higher than Houston and 60% above the $1,184 per capita average for the other nine largest cities.
Likewise, NYC's spending for social services and housing subsidies of $2,156 per capita is nearly 44% higher than the average for the other nine cities; and while all 10 cities spend heavily on public education for dubious results, the$3,678 per capita figure for public education in NYC is considerably higher than the other nine cities, coming in 31% above the average of $2,815 per capita.
On an overall basis, the figures under the "Sub 5-8" column encompass what might be termed total social welfare spending. At$10,671 per capita NYC spends $3,101 per capita more than the average for the other nine largest cities.
And that's nothing to sneeze at. In round dollars it amounts to a $26 billion chunk of the city's towering $105 billion budget or a fiscal burden 1.7X larger than what NYC's already oppressive income tax generates annually ($15 billion).
Per Capita Outlays By Major Function, New York City Versus Next Nine Largest Cities
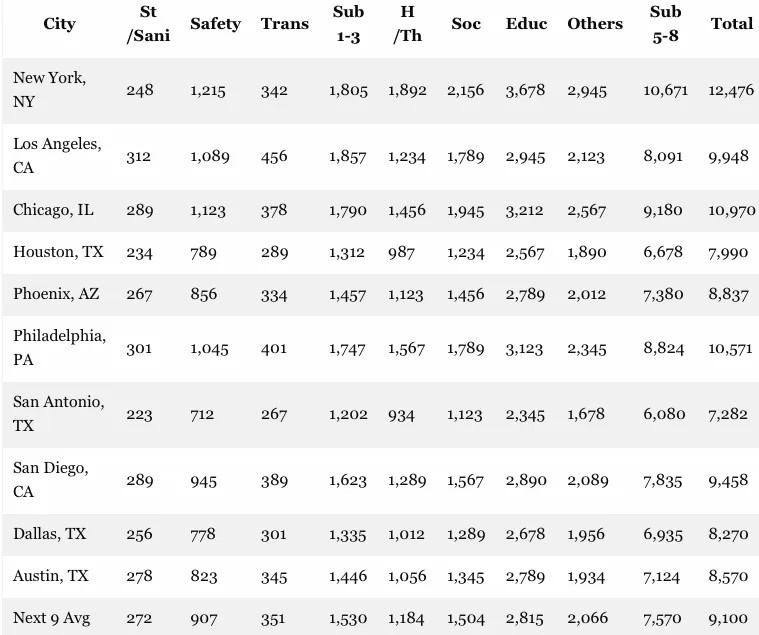
Notes: Sub1-3 = St/Sani + Safety + Trans; Sub5-8 = H/Th + Soc + Educ + Others. Total matches first table. Next 9 Avg: simple average per capita. Plain Markdown for WordPress.
Needless to say, the headroom for additional social welfare generosity was used up long ago by the Big Government lefties who have dominated New York City politics and governance for most of the last century. Yet as is well known by now Mamdani has promised a massive increase in spending for what has been described as his "affordability" platform.
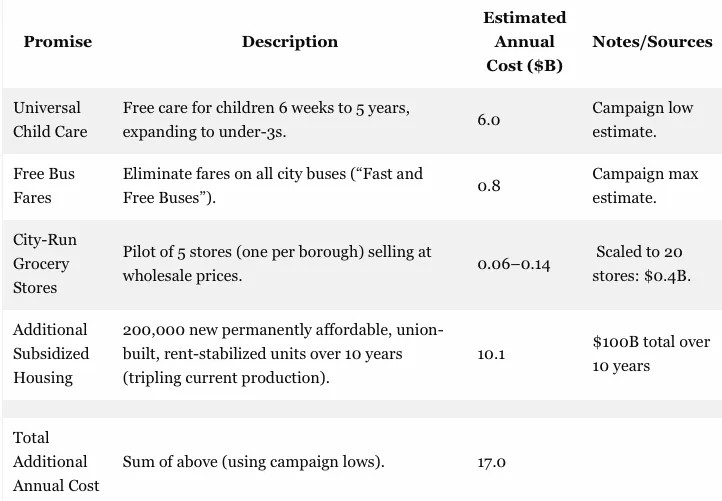
His signature promises thus include free universal child care, free bus fares, city-run grocery stores and expanded subsidized housing (200,000 new affordable units over 10 years) among a multiplicity of new ventures in free stuff. Below is a breakdown of estimated additional annual costs to the NYC budget, based largely on his own campaign's low ball figures.
In the real world, of course, the costs are certain to be far higher. But even then, it you add the $17 billion of new spending shown below to the existing $89 billion NYC budget for social welfare functions implicit in the table above (sub 5-8), social welfare outlays would rise to nearly$13,000 per capita or almost double the average for the next nine largest US cities.
Of course, that's where the rubber of another kind of "affordability" would meet the road. It seems unlikely in the extreme that either a Trumpified Washington or even a vastly over-extended state government in Albany will come riding to the rescue by adding materially to the $28 billion these higher levels of government already provided to the city in FY 2024.
So the $79 billion of own-source financing (OSR) collected by New York City in 2024 would have to be increased by more than +20% to fund even a minimum version of Mamdani's "affordability" platform.
But when you look at the composition of the existing $79 billion of OSR, it doesn't take much imagination to see that a socialist government at City Hall would be hard pressed to retain even the current level of revenues.
For instance, in the case of the $15 billion in annual income tax collections, the top 1%, or 34,000 of the city's 4.2 million income tax filers, account for $6 billion (40%) of the total; and the top 10% account for $11.1 billion or about 75% of the total.
So any attempt to raise the already high city income tax rate is certain to exacerbate the substantial flight to Florida and elsewhere that is already well underway. Yet Mamdani has argued nothing to sweat because his 2% surtax, which would raise the combined city/state income tax rate to nearly 17%, would only impact that top 1% of taxpayers.
Then again, if the city were to loose just 6,000 (18%) of its top bracket taxpayers, income tax revenue would fall by$1 billion per year. And, yes, a "residence" in Florida, where the rate is 0.0% might well stimulate a stampede of tax refugees from a socialist dystopia where the rate is 17%, on top of the 37% which goes to Uncle Sam.
The near certainty of tax flight is even more applicable with respect to the current $7.7 billion of business taxes. Mamdani has proposed to raise the city's corporate tax rate from 7.25% to 11.5%, which would generate $4.5 billion on paper. Alas, in a nation is rife with low-tax states and cities that are already campaigning aggressively for business refugees from New York City, what is likely to move is the tax base going south, not the revenue level heading north.
And when it comes to the near $35 billion from property taxes and real estate transaction taxes the potential drain is enormous. All of these taxes are collected on the basis of New York commercial and residential real estate with a market value of more than $1.5 trillion and an assessed value of $287 billion. But with tax rates on assessed value already high at about $12.50 per $100 on average, any serious recession in real estate market values would send the current $35 billion of property based tax revenue sliding southward.
And there is also Mamdani's throwback to the 1930s. That is, a $30 minimum wage and rent freezes. These long ago discredited relics of populist paternity would surely add to the business flight to venues outside the five boroughs.
In short, New York City was already teetering on the edge of financial breakdown under the current regime of top-in-the-nation spending and tax levels and business unfriendly regulation. So even a small dose of Mamdani's "affordability" socialism is likely to send it careening over the edge.
Then, again, Zohran Mamdani wasn't even born in 1974 when NYC nearly tumbled into bankruptcy the first time. This time he may be just the man to finally complete the job.
Breakout Of New York Cities Own Source Revenues, FY 2024:
- Income taxes: $15.0 billion.
- Property Taxes: $32.7 billion.
- Real Estate Transaction Taxes: $2.2 billion.
- Business taxes: $7.7 billion.
- Sales/Use taxes: $9.8 billion.
- Other taxes and fees: $9.8 billion.
- Total own Source Revenues: $79.4 billion
Reprinted with permission from David Stockman's Contra Corner.